Multiple Choice
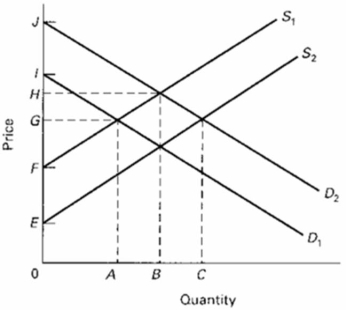
Refer to the below supply and demand graph.Point A represents the current equilibrium level of output of this product and point B represents the optimal level of output from society's perspective.This supply and demand graph indicates that there is (are) : 
A) positive externalities to the production of this product.
B) negative externalities to the production of this product.
C) an overallocation of resources to the production of this product.
D) a negative externality from the production of this product.
Correct Answer:

Verified
Correct Answer:
Verified
Q45: The MB curves in the diagram slope
Q46: Answer the question based on the following
Q47: Which of these is an example of
Q48: A positive externality or external benefit occurs
Q49: A supply-side market failure occurs when supply
Q51: Refer to the supply and demand graph
Q52: A public good:<br>A)generally results in substantial negative
Q53: Efficiency loss refers to:<br>A)the situation where the
Q54: Producer surplus refers to:<br>A)The total amount producer
Q117: If some activity creates external benefits as