Multiple Choice
The graphs below refer to two separate product markets.Assume that society's optimal level of output in each market is Q0 and that government purposely shifts the market supply curve from S to S1 in diagram (a) and from S to S2 in diagram (b) .The shift of the supply curve from S to S1 in diagram (a) might be caused by a per unit: 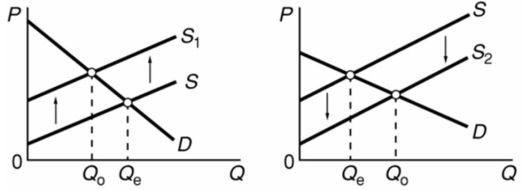
A) subsidy paid to the producers of this product.
B) tax on the producers of this product.
C) subsidy paid to the buyers of this product.
D) tax on the buyers of this product.
Correct Answer:

Verified
Correct Answer:
Verified
Q1: Suppose that Mick and Cher are the
Q125: Examples of quasi-public goods include:<br>A)education.<br>B)highways.<br>C)museums.<br>D)all of the
Q126: Productive efficiency means that the society is
Q127: Answer the next question on the basis
Q128: The graphs below refer to two separate
Q129: The following information is for a public
Q131: One condition for individual bargaining to occur
Q132: The following information is for a public
Q133: Refer to the diagram in which S
Q145: A demand curve for a public good