Multiple Choice
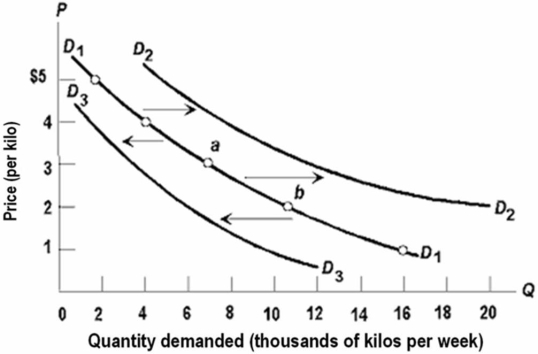 Refer to the above diagram, which shows three demand curves for coffee.Which of the following would cause the change in the demand for coffee illustrated by the shift from D1 to D3?
A) a decrease in the price of tea
B) an increase in consumer incomes
C) a decrease in the price of sugar
D) a technological improvement in the production of coffee
Correct Answer:

Verified
Correct Answer:
Verified
Q3: Surpluses drive market prices up; shortages drive
Q35: If products C and D are close
Q74: We observe a market where the price
Q76: A normal good is one:<br>A)for which quantity
Q77: The table below shows three individual buyers'
Q78: You are asked to determine, other things
Q80: <img src="https://d2lvgg3v3hfg70.cloudfront.net/TB6686/.jpg" alt=" Refer to the
Q81: Which of the following would usually be
Q82: Graphically, the market supply curve is:<br>A)steeper than
Q84: A headline reads "Gasoline Prices Are Higher."