Multiple Choice
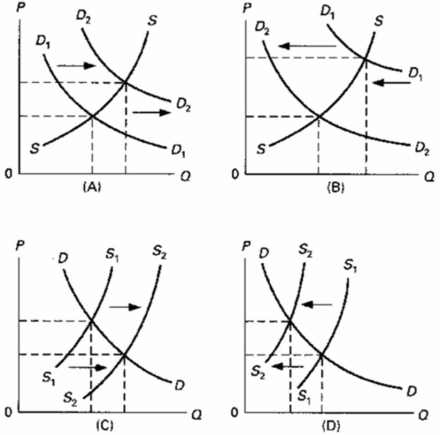 Which of the above diagrams illustrate(s) the effect of an increase in automobile worker wages on the market for automobiles?
A) A only
B) B only
C) C only
D) D only
Correct Answer:

Verified
Correct Answer:
Verified
Related Questions
Q264: In which of the following instances will
Q266: The demand for commodity X is represented
Q267: When the price of a product increases,
Q268: An increase in the price of corn:<br>A)will
Q271: As a result of a decrease in
Q272: Which would cause an increase in quantity
Q273: Refer to the diagram.The equilibrium price and
Q274: You are asked to determine, other things
Q342: If the price of product L increases,
Q356: Other things equal, an excise tax on