Multiple Choice
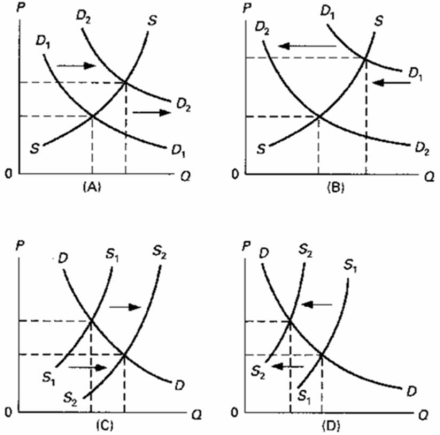 Which of the above diagrams illustrate(s) the effect of an increase in the price of Molson upon the market for Labatt? (Molson and Labatt are brands of beer that are considered to be substitute goods.)
A) A and C
B) A only
C) B only
D) C only
Correct Answer:

Verified
Correct Answer:
Verified
Related Questions
Q2: If X is a normal good, a
Q32: The market system automatically corrects a surplus
Q202: A ceiling price in a competitive market
Q217: With a downward sloping demand curve and
Q218: An increase in consumer incomes will:<br>A)increase the
Q219: Suppose in each of four successive years
Q220: Which factor will increase the demand for
Q222: Refer to the diagram, which shows demand
Q224: The demand curve for a product might
Q225: For most commodities, purchases tend to rise