Multiple Choice
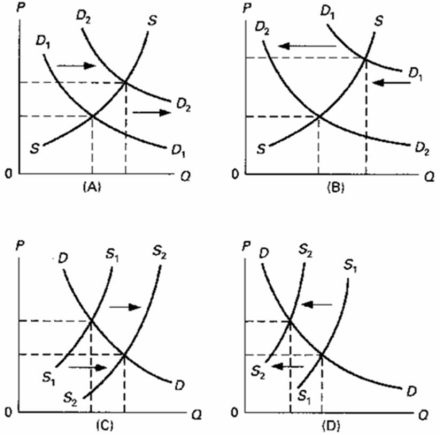 Which of the above diagrams illustrate(s) the effect of a governmental subsidy on the market for AIDS research?
A) A only
B) B only
C) C only
D) D only
Correct Answer:

Verified
Correct Answer:
Verified
Related Questions
Q12: An effective ceiling price will:<br>A) induce new
Q135: If a product is in surplus supply,
Q136: <img src="https://d2lvgg3v3hfg70.cloudfront.net/TB6686/.jpg" alt=" Refer to the
Q137: <img src="https://d2lvgg3v3hfg70.cloudfront.net/TB6686/.jpg" alt=" If peanut butter
Q138: In constructing a stable demand curve for
Q140: A normal good is defined as one:<br>A)whose
Q141: <img src="https://d2lvgg3v3hfg70.cloudfront.net/TB6686/.jpg" alt=" Refer to the
Q142: Refer to the diagram illustrating the market
Q143: Refer to the above graph.X and Y
Q144: A shift to the right in the