Multiple Choice
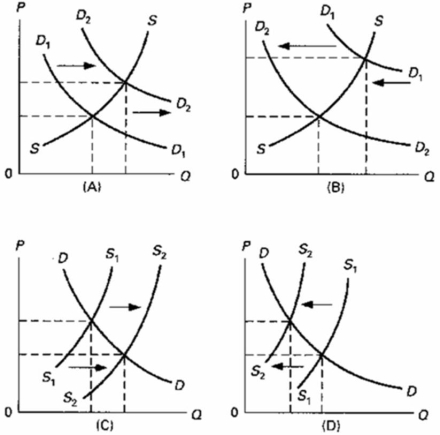 Which of the above diagrams illustrate(s) the effect of a decline in the price of irrigation equipment upon the market for corn?
A) B only
B) C only
C) B and C
D) D only
Correct Answer:

Verified
Correct Answer:
Verified
Related Questions
Q1: A surplus of a product will arise
Q151: Graphically, the market demand curve is:<br>A)steeper than
Q153: Which of the following will cause the
Q154: Which of the following statements is correct
Q156: Students at Informed University pay $40 per
Q157: Refer to the diagram.A price of $2.00
Q158: At the point where the demand and
Q159: The demand for commodity X is represented
Q160: One can say with certainty that equilibrium
Q225: An increase in the quantity demanded means