Multiple Choice
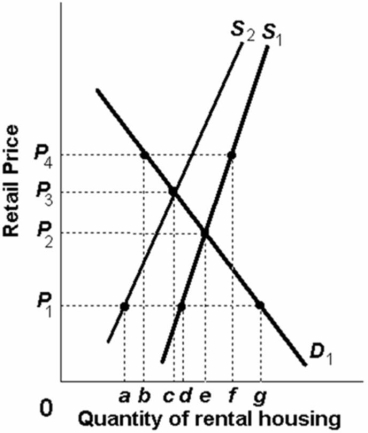 Refer to the above graph, which shows the supply and demand for rental housing in a city.Given the demand D1 and the supply S1 for rental housing, if the government established rent controls in the city at below the equilibrium, then the price of housing would most likely be at:
A) P1 and there would be a shortage of rental housing.
B) P2 and there would be a shortage of rental housing.
C) P3 and there would be a surplus of rental housing.
D) P4 and there would be a surplus of rental housing.
Correct Answer:

Verified
Correct Answer:
Verified
Q273: Refer to the diagram.The equilibrium price and
Q274: You are asked to determine, other things
Q275: Which of the following would most likely
Q276: Suppose product X is an input in
Q277: <img src="https://d2lvgg3v3hfg70.cloudfront.net/TB6686/.jpg" alt=" If peanut butter
Q279: What combination of changes would most likely
Q280: The law of demand states that:<br>A)price and
Q281: <img src="https://d2lvgg3v3hfg70.cloudfront.net/TB6686/.jpg" alt=" The equation for
Q282: You are asked to determine, other things
Q283: When an economy achieves both allocative and