Multiple Choice
The following graph represents a competitive market for a product.where the government now has introduced a price floor of 0C.Which area in the graph represents the producers' revenue after the imposition of the price floor? 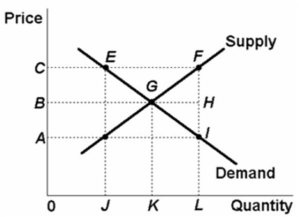
A) 0CFL
B) 0CEJ
C) 0BGK
D) 0BHL
Correct Answer:

Verified
Correct Answer:
Verified
Q1: The minimum wage imposes a legal floor
Q2: For some commodities, purchases tend to decrease
Q3: The income and substitution effects account for:<br>A)the
Q5: Uber's pricing model creates what type of
Q6: A television station reports that the price
Q7: An "increase in demand" means that:<br>A)given supply,
Q8: Assume the demand curve for product X
Q9: All of the following are held to
Q10: During the 1970s the price of oil
Q11: The law of supply:<br>A)reflects the amounts which