Essay
In the below diagram assume that the aggregate demand curve shifts from AD1 in year 1 to AD2 in year 2, only to fall back to AD1 in year 3. 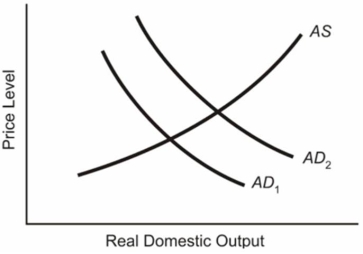 (a) Explain what will happen to the equilibrium price level and the equilibrium level of real GDP from year 1 to year 2.(b) Locate the new position in year 3 on the assumption that prices and wages are completely flexible downward.Label this position, Pb and GDPb for the price level and real GDP respectively.(c) Locate the new position in year 3 on the assumption that prices and wages are completely inflexible downward.Label this position, Pc and GDPc for the price level and real GDP respectively.
Correct Answer:

Verified
(a) Equilibrium pric...View Answer
Unlock this answer now
Get Access to more Verified Answers free of charge
Correct Answer:
Verified
View Answer
Unlock this answer now
Get Access to more Verified Answers free of charge
Q14: Is the downward price inflexibility applicable to
Q15: Explain the relationship between the aggregate expenditures
Q16: Suppose that a hypothetical economy has the
Q17: Suppose the aggregate demand and short-run aggregate
Q20: In the table below are aggregate demand
Q21: How is the long-run aggregate supply curve
Q22: List the three major determinants that can
Q24: The determinants of aggregate demand "determine" the
Q44: Explain the three reasons given for the
Q157: How can the aggregate demand curve be