Essay
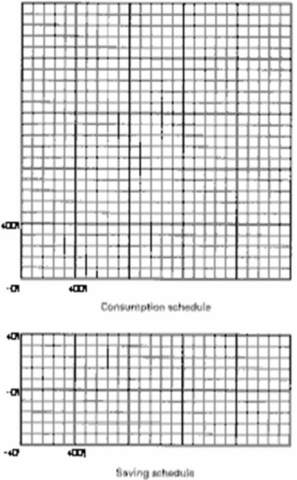
Complete the accompanying table.  Using the below graphs, show the consumption and saving schedules graphically.
  (b) Locate the break-even level of income.How is it possible for households to dissave at very low income levels?
(c) If the proportion of total income consumed decreases and the proportion saved increases as income rises, explain both verbally and graphically how the MPC and MPS can be constant at various levels of income.
Correct Answer:

Verified
(b) The break-even level of income is 52...View Answer
Unlock this answer now
Get Access to more Verified Answers free of charge
Correct Answer:
Verified
View Answer
Unlock this answer now
Get Access to more Verified Answers free of charge
Q12: What are the marginal propensity to consume
Q13: What are two key facts that serve
Q14: State four factors that explain why investment
Q15: List six events that could cause a
Q16: Differentiate between the average propensity to consume
Q18: Describe the relationship shown by the investment
Q19: Describe the relationship between the Great Recession
Q20: Suppose a family's annual disposable income is
Q21: Define the multiplier.How is it related to
Q22: Most economists regard investment demand as being