Essay
The next three questions refer to the below supply and demand graph for a public good. 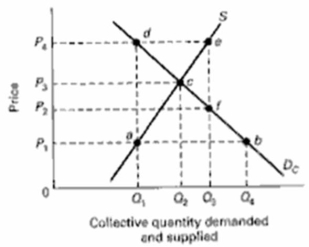 (a) What does point c represent?
(b) What does the line segment ef at output Q3 represent?
(c) At what output level is there an underallocation of resources to the production of this public good?
Correct Answer:

Verified
(a) Where the marginal benefit of an add...View Answer
Unlock this answer now
Get Access to more Verified Answers free of charge
Correct Answer:
Verified
View Answer
Unlock this answer now
Get Access to more Verified Answers free of charge
Q2: Assume the atmosphere of an urban area
Q3: How is consumer surplus derived from a
Q4: What resource problem is created by negative
Q5: Evaluate.Economy in government requires that government minimize
Q6: What resource problem is created by positive
Q8: How does the market demand curve for
Q9: Draw a market demand curve and indicate
Q10: What are negative and positive externalities? How
Q11: Imagine that a provincial government is considering
Q12: Draw a market supply curve and indicate