Essay
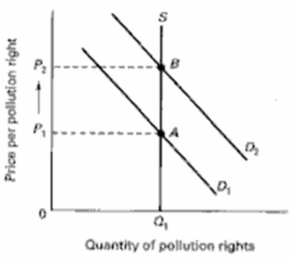
Draw a supply and demand graph on the below diagram that illustrates the market for pollution rights.Label the axes and curves.Then show what happens to price and quantity when the demand for pollution rights increases in the market. 
Correct Answer:

Verified
Demand increases from D1 to D2, which rais...View Answer
Unlock this answer now
Get Access to more Verified Answers free of charge
Correct Answer:
Verified
View Answer
Unlock this answer now
Get Access to more Verified Answers free of charge
Q21: Describe how a market for externality rights
Q22: The demand and supply in a market
Q23: Supply in a market is represented by
Q24: The following table shows marginal costs and
Q25: What is consumer surplus?
Q27: What is producer surplus?
Q28: Assume the atmosphere of an urban area
Q29: What are the basic differences between a
Q30: Demand is represented by the equation, P
Q31: In your own words, describe what free-riding