Essay
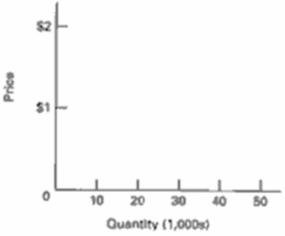
Using the schedules given, plot the demand curve and the supply curve on the below graph.Label the axes and indicate for each axis the units being used to measure price and quantity.Then answer the questions. 
 (a) Give the equilibrium price and quantity for oats.(b) Indicate the equilibrium price and quantity on the graph by drawing lines from the intersection of the supply and demand curves to the price and quantity axes.(c) If the Federal government decided to support the price of oats at $1.40 per ton, tell whether there would be a surplus or shortage and how much it would be.(d) Demonstrate your answer to part (c) on your graph being sure to label the quantity you designated as the shortage or surplus.
Correct Answer:

Verified
(a) The equilibrium price and quantity f...View Answer
Unlock this answer now
Get Access to more Verified Answers free of charge
Correct Answer:
Verified
View Answer
Unlock this answer now
Get Access to more Verified Answers free of charge
Q24: Suppose that a decrease in the price
Q25: Demand is represented by the equation, P
Q26: List six basic determinants of market supply
Q27: Use the data in the following table
Q30: (a) Using the schedules given, determine the
Q31: Give two explanations for the law of
Q33: Despite a lower price for its product,
Q34: Using the schedules given, plot the demand
Q54: What is the difference between a change
Q127: What is a price floor, and what