Multiple Choice
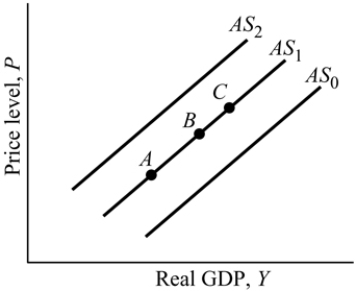 Figure 9.4
-Refer to Figure 9.4. An increase in aggregate supply is represented by:
A) a movement from Point C to Point A along AS1.
B) a shift from AS1 to AS2.
C) a movement from Point B to Point A along AS1.
D) a shift from AS1 to AS0.
Correct Answer:

Verified
Correct Answer:
Verified
Related Questions
Q6: In the short- run, an increase in
Q7: An increase in the price level results
Q8: When output falls below full employment output,
Q9: If the marginal propensity to consume is
Q10: Compared to the long run aggregate supply
Q12: List three things that could shift the
Q13: Using the AS- AD diagram, show the
Q14: If an automobile maker producing a certain
Q15: Production inputs such as steel rods have
Q16: A leftward shift in the aggregate demand