Multiple Choice
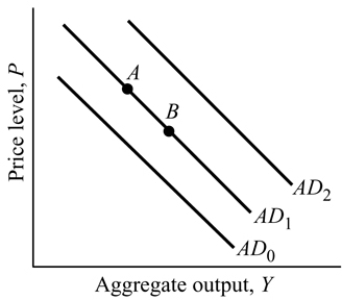 Figure 9.1
-Refer to Figure 9.1. When the price level drops and causes a higher net exports, it is illustrated as:
A) an aggregate demand curve shift from AD1 to AD0.
B) an aggregate demand curve shift from AD1 to AD2.
C) a move from Point A to Point B, but not a shift of the aggregate demand curve.
D) a move from Point B to Point A, but not shift of the aggregate demand curve.
Correct Answer:

Verified
Correct Answer:
Verified
Q158: Along the short run supply curve, when
Q159: The multiplier is always larger than one
Q160: <img src="https://d2lvgg3v3hfg70.cloudfront.net/TB5231/.jpg" alt=" Figure 9.4 -Refer
Q161: Holding other factors constant, an increase in
Q162: In the short run, an increase in
Q164: If the marginal propensity to consume is
Q165: Many economists have argued that oil prices
Q166: <img src="https://d2lvgg3v3hfg70.cloudfront.net/TB5231/.jpg" alt=" Figure 9.4 -Refer
Q167: Recall Application 2, "Two Approaches to Determining
Q168: If the economy is in long run