Multiple Choice
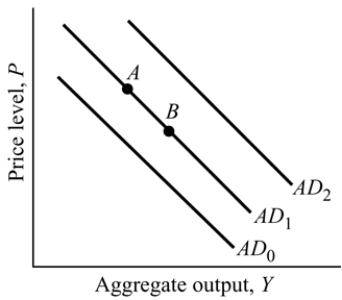 Figure 9.1
-Refer to Figure 9.1. When the price level rises and causes lower consumption expenditures, it is illustrated as:
A) a move from Point A to Point B, but not a shift of the aggregate demand curve.
B) an aggregate demand curve shift from AD1 to AD2.
C) a move from Point B to Point A, but not a shift of the aggregate demand curve.
D) an aggregate demand curve shift from AD1 to AD0.
Correct Answer:

Verified
Correct Answer:
Verified
Q134: If the economy is in equilibrium at
Q135: If the marginal propensity to consume is
Q136: Recall Application 1, "Measuring Price Stickiness in
Q137: Steel rod prices are an example of:<br>A)
Q138: Why is the long- run aggregate supply
Q140: Recall Application 3, "How the U.S. Economy
Q141: Sticky prices are a result of:<br>A) lack
Q142: In the consumption function C = Ca
Q143: The international effect explanation of the downward
Q144: _ is a curve that shows the