Multiple Choice
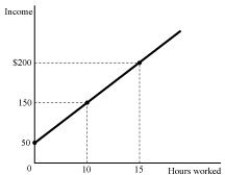 Figure 1.1
-Refer to Figure 1.1. The relationship between hours worked and income, as shown by the graph in Figure 1.1 is:
A) exponential.
B) nonlinear.
C) negative.
D) positive.
Correct Answer:

Verified
Correct Answer:
Verified
Related Questions
Q93: Using assumptions to make things simpler and
Q103: Bill Gates, with his $53 billion fortune,
Q104: Because resources are limited:<br>A) people must make
Q105: A straight line graph shows<br>A) the relationships
Q106: Which of the following is a microeconomic
Q108: Recall Application 1, "Responding to Production Rewards,"
Q110: To think at the margin means to
Q112: Unrealistic simplifying assumptions should be avoided because
Q112: The reason why spammers find it profitable
Q137: Scarcity is a situation in which resources