Multiple Choice
Refer to the graph given below. 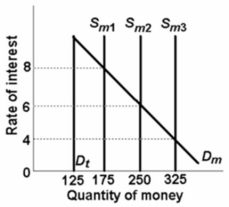 In the above graph, Dt represents the transactions demand for money, Dm represents the total demand for money, and Sm represents the supply of money.The transactions demand for money in this market is:
A) $125.
B) $175.
C) $250.
D) $325.
Correct Answer:

Verified
Correct Answer:
Verified
Q10: An increase in nominal GDP increases the
Q12: An expansionary monetary policy may be more
Q26: The strengths of monetary policy compared to
Q63: In recent years, the Bank of Canada
Q98: <img src="https://d2lvgg3v3hfg70.cloudfront.net/TB6686/.jpg" alt=" Refer to the
Q104: It is assumed that households and businesses
Q111: The asset demand for money<br>A) is unrelated
Q126: A decrease in the rate of interest
Q216: Which of the following statements is correct?
Q388: A consumer holds money to meet spending