Multiple Choice
Refer to the graph below, in which Dt is the transactions demand for money, Dm is the total demand for money, and Sm is the supply of money.If the market for money is in equilibrium at a 6 percent rate of interest and the money supply increases, then Sm2 will shift to: 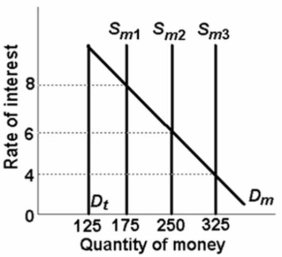
A) Sm3 and the interest rate will be 4 percent.
B) Sm3 and the interest rate will be 8 percent.
C) Sm1 and the interest rate will be 8 percent.
D) Sm1 and the interest rate will be 4 percent.
Correct Answer:

Verified
Correct Answer:
Verified
Q51: The easy money of Japan during the
Q74: The Special Purchase and Resale Agreement (SPRA),
Q86: The major purpose of the Bank of
Q99: In the Bank of Canada's consolidated balance
Q100: An expansionary monetary policy reduces the supply
Q127: The reserves of the chartered banks are
Q128: On a diagram wherein the interest rate
Q130: On a diagram wherein the interest rate
Q195: <img src="https://d2lvgg3v3hfg70.cloudfront.net/TB6686/.jpg" alt=" Which line in
Q199: Refer to the information below.If the money