Multiple Choice
Refer to the graphs below.The first graph shows the money market of an economy, and the second graph shows the market for goods and services in the economy. 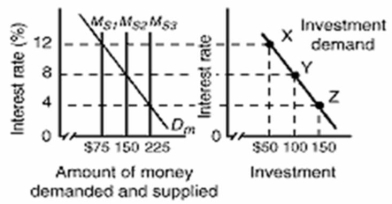
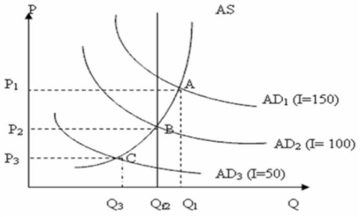 In the above diagrams, the numbers in the parentheses after the AD1, AD2, and AD3 labels indicate the levels of investment spending associated with each AD curve.All figures are in billions.Qf is the full-employment level of real output.The interest rate in the economy is 4 percent.Which of the following should the monetary authorities do to achieve a non-inflationary full-employment level of real GDP?
A) They should increase the money supply from $75 billion to $225 billion.
B) They should decrease the money supply by $150 billion.
C) They should decrease the money supply from $225 billion to $150 billion.
D) They should increase the money supply by $200 billion.
Correct Answer:

Verified
Correct Answer:
Verified
Q4: Because of the liquidity trap, the Bank
Q87: Assume that a single chartered bank has
Q122: <img src="https://d2lvgg3v3hfg70.cloudfront.net/TB6686/.jpg" alt=" Refer to the
Q137: The interest rate will fall when the<br>A)
Q141: In 2004, the Bank of Canada reduced
Q150: Which of the following statements is correct?<br>A)
Q163: A disequilibrium in the market for money
Q198: The purpose of a restrictive monetary policy
Q215: A restrictive monetary policy in Canada is
Q231: An expansionary monetary policy is designed to