Multiple Choice
Refer to the graphs below.The first graph shows the money market of an economy, and the second graph shows the market for goods and services in the economy. 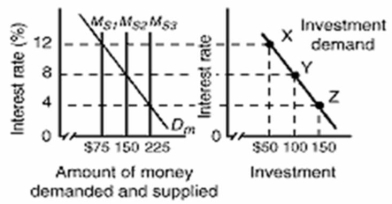
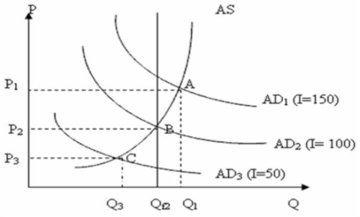 In the above diagrams, the numbers in the parentheses after the AD1, AD2, and AD3 labels indicate the levels of investment spending associated with each AD curve.All figures are in billions.Qf is the full-employment level of real output.Suppose the economy is in equilibrium at point C on the aggregate demand curve.Which of the following should the monetary authorities pursue to achieve a non-inflationary full-employment level of real GDP?
A) They should increase the money supply from $75 billion to $150 billion.
B) They should increase the money supply from $150 billion to $225 billion.
C) They should decrease the money supply from $225 billion to $50 billion.
D) They should decrease interest rates from 12 percent to 4 percent.
Correct Answer:

Verified
Correct Answer:
Verified
Q5: <img src="https://d2lvgg3v3hfg70.cloudfront.net/TB6686/.jpg" alt=" Refer to the
Q6: Refer to the diagram below for the
Q12: <img src="https://d2lvgg3v3hfg70.cloudfront.net/TB6686/.jpg" alt=" Refer to the
Q30: Which of the following best describes the
Q45: Notes in circulation are:<br>A)an asset as viewed
Q46: The reason for the Bank of Canada
Q70: The asset demand for money varies directly
Q84: All else equal, when the Bank of
Q229: By early 2008 it became evident that
Q294: A restrictive monetary policy reduces investment spending