Multiple Choice
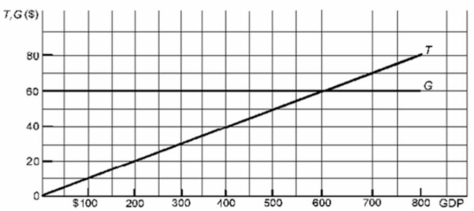 Refer to the above diagram where T is tax revenues and G is government expenditures.All figures are in billions of dollars.If the full-employment GDP is $400 billion while the actual GDP is $200 billion, the:
A) actual budget deficit exceeds the full-employment deficit.
B) actual budget deficit is less than the full-employment deficit.
C) full-employment deficit exceeds the cyclical deficit.
D) cyclical deficit exceeds the full-employment deficit.
Correct Answer:

Verified
Correct Answer:
Verified
Q14: The lag between the time the need
Q32: The key to assessing whether fiscal policy
Q34: The net export effect works through international
Q43: <img src="https://d2lvgg3v3hfg70.cloudfront.net/TB6686/.jpg" alt=" Refer to the
Q84: In Year 1, the actual budget deficit
Q91: An example of a built-in automatic stabilizer
Q93: The Federal budget deficit is calculated each
Q168: In an economy, the government wants to
Q169: It is more meaningful to measure the
Q173: The crowding-out effect may be dampened if