Multiple Choice
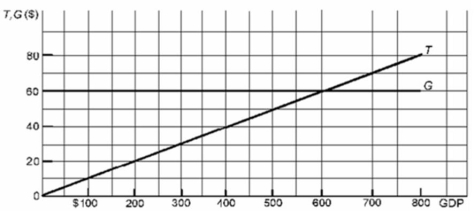 Refer to the above diagram where T is tax revenues and G is government expenditures.All figures are in billions of dollars.If the full-employment GDP and actual GDP are each $400 billion, this economy will realize a:
A) full-employment or structural deficit of $20 billion.
B) cyclical deficit of $20 billion.
C) cyclical surplus of $20 billion.
D) full-employment deficit of zero.
Correct Answer:

Verified
Correct Answer:
Verified
Q12: The "political business cycle" refers to the
Q36: Built-in stabilizers:<br>A)intensify the business cycle.<br>B)reduce the size
Q43: Expansionary fiscal policy will do what to
Q135: The crowding-out effect from government borrowing to
Q164: Fiscal policy refers to the:<br>A)manipulation of government
Q199: (1) The composite index of leading indicators
Q215: (1) The composite index of leading indicators
Q216: A decrease in government spending and taxes
Q221: <img src="https://d2lvgg3v3hfg70.cloudfront.net/TB6686/.jpg" alt=" Refer to the
Q224: <img src="https://d2lvgg3v3hfg70.cloudfront.net/TB6686/.jpg" alt=" Refer to the