Multiple Choice
 Lines A and B in the above graph represent:
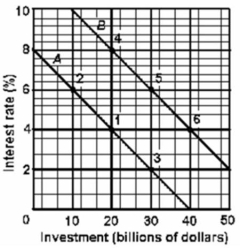
A) the crowding-out effect.
B) the interest-rate effect.
C) investment demand curves.
D) money demand curves.
Correct Answer:

Verified
Correct Answer:
Verified
Related Questions
Q39: An expansionary fiscal policy is shown as
Q42: If the MPC in the economy is
Q79: If the economy has a cyclically adjusted
Q104: Which is regarded as an automatic stabilizer
Q118: Refer to the data below.If year 1
Q119: <img src="https://d2lvgg3v3hfg70.cloudfront.net/TB6686/.jpg" alt=" Refer to the
Q143: The cyclically adjusted deficit is the difference
Q175: If a deficit is financed by issuing
Q186: As a percent of GDP, Canada's public
Q227: In a certain year the aggregate demand