Multiple Choice
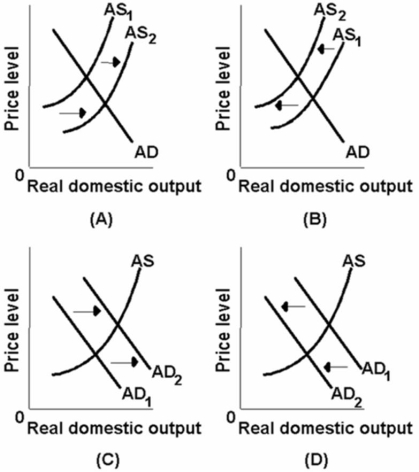 Which of the above diagrams best portrays the effects of declines in the prices of imported resources?
A) A
B) B
C) C
D) D
Correct Answer:

Verified
Correct Answer:
Verified
Related Questions
Q40: Suppose the full-employment level of real output
Q42: <img src="https://d2lvgg3v3hfg70.cloudfront.net/TB6686/.jpg" alt=" Refer to the
Q43: Suppose the full-employment level of real output
Q50: Other things equal, the short-run aggregate supply
Q55: The aggregate supply curve slopes downward.
Q58: The real-balances, interest rate, and foreign trade
Q108: An increase in the price level, other
Q137: Productivity measures<br>A) real output per unit of
Q142: Which of the following is true of
Q155: An increase in the price level in