Multiple Choice
Refer to the figure given below. 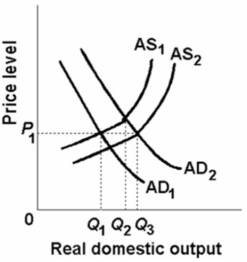 In the above figure, AD1 and AS1 represent the original aggregate demand and aggregate supply curves, respectively.AD2 and AS2 show the new aggregate demand and aggregate supply curves.The change in aggregate supply from AS1 to AS2 could be caused by:
A) a reduction in the price level.
B) an increased availability of entrepreneurial talent.
C) an increase in business taxes.
D) the real-balances effect, interest-rate effect, and foreign-trade effect.
Correct Answer:

Verified
Correct Answer:
Verified
Q94: Cost-push inflation arises from:<br>A)a decrease in aggregate
Q111: Suppose that real domestic output in an
Q114: The following list of items are related
Q118: An increase in the GDP price level
Q172: Which would increase aggregate supply?<br>A)an increase in
Q194: The following table is for a particular
Q197: Refer to the diagram given below. <img
Q203: In deriving the aggregate demand curve from
Q219: Cost-push inflation is characterized by a(n)<br>A)increase in
Q305: The interest-rate effect suggests that<br>A) a decrease