Multiple Choice
Refer to the figure below. 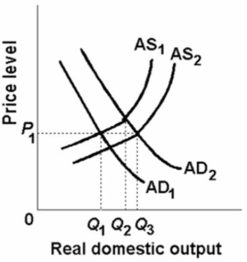 In the above figure, AD1 and AS1 represent the original aggregate demand and aggregate supply curves, respectively.AD2 and AS2 show the new aggregate demand and supply curves.The changes in aggregate demand and aggregate supply result in a(n) :
A) increase in the price level.
B) increase in the real output and no change in the price level.
C) increase in the real output and the price level.
D) decline in the real output and no change in the price level.
Correct Answer:

Verified
Correct Answer:
Verified
Q9: Refer to the list below.Which two factors
Q10: If the price level increases in Canada
Q53: The Great Moderation refers to:<br>A)the period from
Q59: Which one of the following would increase
Q75: Shifts in the aggregate supply curve are
Q105: Which of the following explains why the
Q108: Refer to the diagram given below. <img
Q108: Which effect best explains the downward slope
Q167: An increase in consumer wealth will decrease
Q227: If the dollar price of foreign currencies