Multiple Choice
 Refer to the above diagrams.Curve A:
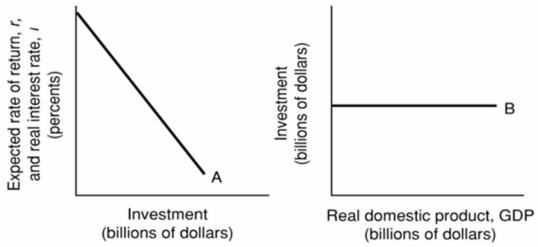
A) is an investment schedule and curve B is a consumption of fixed capital schedule.
B) is an investment demand curve and curve B is an investment schedule.
C) and B are totally unrelated.
D) shifts to the left when curve B shifts upward.
Correct Answer:

Verified
Correct Answer:
Verified
Q50: The inequality of saving and planned investment:<br>A)is
Q120: If a nation imposes tariffs and quotas
Q135: If government expenditures increase by $20 billion
Q151: If government decreases its purchases by $20
Q172: In reality, if a nation imposes tarrifs,
Q184: <img src="https://d2lvgg3v3hfg70.cloudfront.net/TB6686/.jpg" alt=" In the above
Q188: The table shows the consumption schedule for
Q192: <img src="https://d2lvgg3v3hfg70.cloudfront.net/TB6686/.jpg" alt=" Refer to the
Q230: In reality, if a nation devalues its
Q233: During the recession of 2008-2009 the federal