Multiple Choice
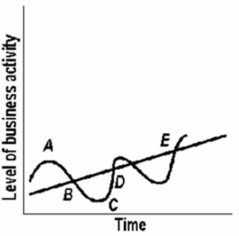 Refer to the above diagram.The straight line E drawn through the wavy lines would provide an estimate of the:
A) recession fluctuation.
B) growth trend.
C) natural rate of unemployment.
D) expansion trend.
Correct Answer:

Verified
Correct Answer:
Verified
Related Questions
Q7: As applied to the price level, the
Q8: If the natural rate of unemployment was
Q20: Cost-push inflation may be caused by<br>A)a decline
Q94: If a person's nominal income increases by
Q98: If the price level increases by 15
Q104: In defending a mild inflation rate in
Q133: The unemployment rate in an economy is
Q140: In which of the following years was
Q145: Which statement about inflation is correct?<br>A)Families are
Q202: Unanticipated inflation benefits debtors at the expense