Multiple Choice
The graphs below refer to two separate product markets.Assume that society's optimal level of output in each market is Q0 and that government purposely shifts the market supply curve from S to S1in diagram (a) and from S to S2 in diagram (b) .We can conclude that the government is correcting for: 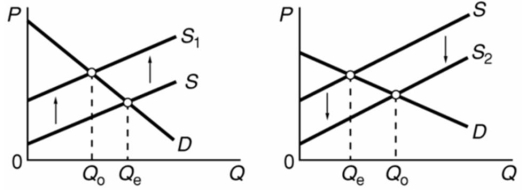
A) negative externalities in diagram (a) and positive externalities in diagram (b) .
B) positive externalities in diagram (a) and negative externalities in diagram (a) .
C) negative externalities in both diagrams.
D) positive externalities in both diagrams.
Correct Answer:

Verified
Correct Answer:
Verified
Q24: Refer to the below competitive market diagram
Q25: The following table presents the demand schedule
Q29: Market for asparagus.At the market price of
Q40: The creation of a market for pollution
Q54: Producer surplus refers to:<br>A)The total amount producer
Q80: Society's marginal cost of pollution moderation curve
Q89: When the full willingness to pay for
Q92: The term "allocative efficiency" refers to:<br>A)the production
Q115: When the government of a country levies
Q145: A demand curve for a public good