Multiple Choice
The graphs below refer to two separate product markets.Assume that society's optimal level of output in each market is Q0 and that government purposely shifts the market supply curve from S to S1 in diagram (a) and from S to S2 in diagram (b) .The shift of the supply curve from S to S1 in diagram (a) might be caused by a per unit: 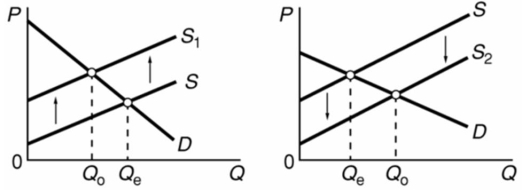
A) subsidy paid to the producers of this product.
B) tax on the producers of this product.
C) subsidy paid to the buyers of this product.
D) tax on the buyers of this product.
Correct Answer:

Verified
Correct Answer:
Verified
Q6: Suppose that a large tree on Shawn's
Q31: For which one of the following would
Q35: Quasi-public goods are:<br>A)government produced goods that can
Q58: Refer to the diagram in which S
Q59: Answer the question based on the following
Q68: In which of the following ways does
Q103: If the price of a product increases:<br>A)the
Q108: Positive externalities are likely to cause:<br>A)underallocation of
Q117: If some activity creates external benefits as
Q126: Productive efficiency means that the society is