Multiple Choice
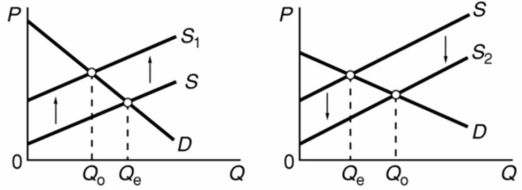
The graphs below refer to two separate product markets.Assume that society's optimal level of output in each market is Q0 and that government purposely shifts the market supply curve from S to S1 in diagram (a) and from S to S2 in diagram (b) .The shift of the supply curve from S to S2 in diagram (b) might be caused by a per unit: 
A) subsidy paid to the producers of this product.
B) tax on the producers of this product.
C) subsidy paid to the buyers of this product.
D) tax on the buyers of this product.
Correct Answer:

Verified
Correct Answer:
Verified
Q1: The external costs of severe air pollution
Q14: There is a positive relationship between equilibrium
Q32: In a market where there are external
Q47: Which of these is an example of
Q53: Efficiency loss refers to:<br>A)the situation where the
Q72: It has been proposed that a government
Q83: The major difficulty in asking people to
Q104: A demand-side market failure occurs when demand
Q109: Assume there is no way to prevent
Q113: Market failures<br>A)fall only on the demand-side.<br>B)fall only