Multiple Choice
 The equation for the demand curve in the above diagram:
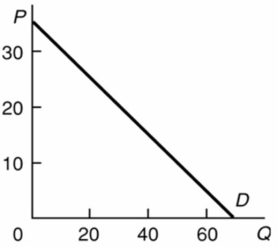
A) is P = 70 - Q.
B) is P = 35 - 2Q.
C) is P = 35 - .5Q.
D) cannot be determined from the information given.
Correct Answer:

Verified
Correct Answer:
Verified
Related Questions
Q59: The higher a price floor is above
Q74: We observe a market where the price
Q91: <img src="https://d2lvgg3v3hfg70.cloudfront.net/TB6686/.jpg" alt=" Refer to the
Q103: Which of the following will cause a
Q115: Tennis rackets and ballpoint pens are:<br>A) substitute
Q130: The further a ceiling price is below
Q160: One can say with certainty that equilibrium
Q242: When product prices change, consumers are inclined
Q247: If Z is an inferior good, a
Q256: According to the rationing function of prices,