Multiple Choice
 Refer to the above diagram.Curve B is a:
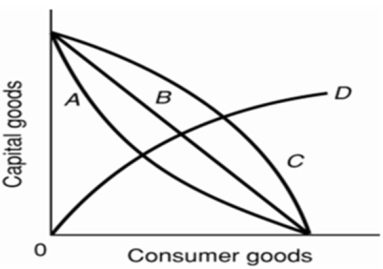
A) production possibilities curve indicating constant opportunity costs.
B) production possibilities curve indicating increasing opportunity costs.
C) demand curve indicating that the quantity of consumer goods demanded increases as the price of capital falls.
D) technology frontier curve.
Correct Answer:

Verified
Correct Answer:
Verified
Q1: When an economist says that material wants
Q2: An economy will always operate at some
Q45: Marginal costs exist because:<br>A)the decision to produce
Q52: If economic theories are solidly based on
Q65: Tammie makes $150 a day as a
Q79: The slope of a line parallel to
Q99: Assume that if the interest rate that
Q101: <img src="https://d2lvgg3v3hfg70.cloudfront.net/TB6686/.jpg" alt=" Refer to the
Q112: The society must also make choices under
Q137: Purposeful behaviour suggests that:<br>A)everyone will make identical