Multiple Choice
 Refer to the above diagram.The equation which shows the relationship between Y and X is:
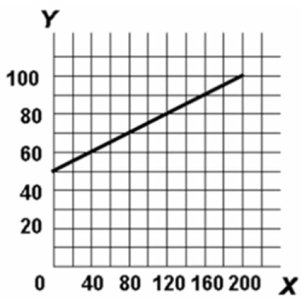
A) Y = 50 + 1/4X.
B) X = 1/4Y.
C) Y = .4X.
D) Y = 1/4X - 50.
Correct Answer:

Verified
Correct Answer:
Verified
Q71: The amount of pizzas that consumers want
Q90: The output of blu ray players should
Q92: Economic models:<br>A)are of limited use because they
Q167: The fundamental problem of economics is:<br>A)to establish
Q202: The production possibilities curve represents which of
Q214: Opportunity cost is best defined as:<br>A)marginal cost
Q249: <img src="https://d2lvgg3v3hfg70.cloudfront.net/TB6686/.jpg" alt=" Refer to the
Q252: <img src="https://d2lvgg3v3hfg70.cloudfront.net/TB6686/.jpg" alt=" Refer to the
Q254: Production possibilities tables for two countries, North
Q256: <img src="https://d2lvgg3v3hfg70.cloudfront.net/TB6686/.jpg" alt=" In the above