Essay
The table below shows the maximum amounts of food and clothing that two nations, A and B, can produce.Draw the production possibilities curve for A and B using the below graphs.Assume constant costs. 
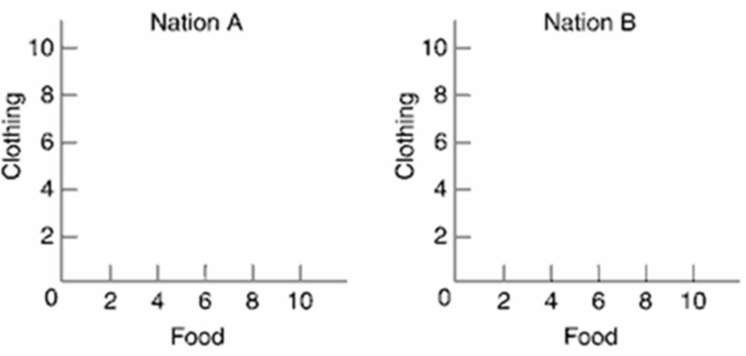 (a) What is the cost ratio for the two products?(b) If each nation specializes according to comparative advantage, who should produce and trade each product? Why?(c) What will be the range for the terms of trade? If the terms are set at 1 food = 2 clothing, show how the trading possibilities lines will change in the graph.Explain.
Correct Answer:

Verified
 (a) The cost of 1 unit of food for nati...
View Answer
Unlock this answer now
Get Access to more Verified Answers free of charge
Correct Answer:
Verified
View Answer
Unlock this answer now
Get Access to more Verified Answers free of charge
Q1: Suppose that by devoting all of its
Q4: In 2016, what were the top five
Q16: Answer the next three questions on the
Q18: Identify the four basic types of trade
Q19: What is the problem associated with the
Q26: Of all the reason for protests against
Q29: Evaluate the statement: "Tariffs and quotas are
Q36: Why might trade barriers be a highly
Q40: What are the limitations to the diversification
Q180: Cite three important reasons why nations trade.