Essay
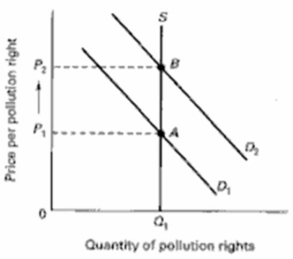
Draw a supply and demand graph on the below diagram that illustrates the market for pollution rights.Label the axes and curves.Then show what happens to price and quantity when the demand for pollution rights increases in the market. 
Correct Answer:

Verified
Demand increases from D1 to D2, which rais...View Answer
Unlock this answer now
Get Access to more Verified Answers free of charge
Correct Answer:
Verified
View Answer
Unlock this answer now
Get Access to more Verified Answers free of charge
Q2: The following table shows marginal costs and
Q5: Evaluate.Economy in government requires that government minimize
Q7: Draw a market supply curve and indicate
Q8: How does the market demand curve for
Q10: What are negative and positive externalities? How
Q16: Explain the difference between a public and
Q17: Demand in a market is represented by
Q21: Describe how a market for externality rights
Q23: Supply in a market is represented by
Q35: Demand is represented by the equation, P