Multiple Choice
The figure below shows a family of cost curves for a firm. The subscripts 1, 2, and 3 for the SRATC curves refer to different plant sizes. 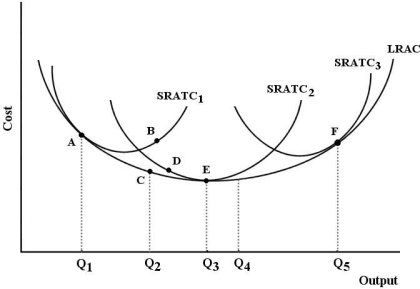 FIGURE 8- 3
-Refer to Figure 8- 3. Should this firm ever consider moving from point E (output level Q3 on SRATC2) to point F (output level Q5 on SRATC3) ?
A) Yes, because the firm can take advantage of economies of scale.
B) Yes, if the product price rises enough to lead the firm to expand to plant size 3.
C) No, because they are already producing at their lowest possible cost at point E.
D) No, because producing at point F implies a higher cost per unit of output.
E) Yes, because SRATC3 is the optimal plant size for this firm.
Correct Answer:

Verified
Correct Answer:
Verified
Q82: A profit- maximizing firm with variable labour
Q83: <img src="https://d2lvgg3v3hfg70.cloudfront.net/TB5438/.jpg" alt=" FIGURE 8- 4
Q84: The figure below shows the isocost lines
Q85: Assume a firm is using 10 units
Q86: Consider a firm that uses only labour
Q88: A firm's long- run average cost curve<br>A)
Q89: Isocost lines are downward sloping straight lines,
Q90: Increasing returns to scale for a firm
Q91: Any point representing a cost and output
Q92: The following table shows the marginal