Multiple Choice
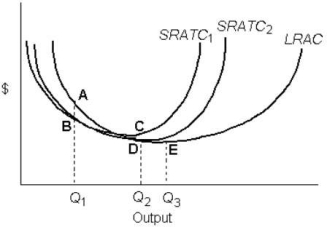 FIGURE 8- 2
-Refer to Figure 8- 2. Increasing returns to scale occur over the output range
A) Q2 to Q3 only.
B) beyond Q3 only.
C) 0 to Q1 only.
D) Q1 to Q2 only.
E) 0 to Q3 only.
Correct Answer:

Verified
Correct Answer:
Verified
Q31: The point of tangency between the short-
Q33: The figure below shows the isocost lines
Q37: Isoquants are usually drawn convex when viewed
Q38: Suppose that capital costs $50 per unit
Q40: The principle of substitution plays a central
Q41: Suppose that capital costs $6 per unit
Q81: <img src="https://d2lvgg3v3hfg70.cloudfront.net/TB7542/.jpg" alt=" FIGURE 8-2 -Refer
Q108: Suppose that capital costs $10 per unit
Q116: <img src="https://d2lvgg3v3hfg70.cloudfront.net/TB5441/.jpg" alt=" FIGURE 8-4 -Refer
Q134: The following table shows the marginal products