Multiple Choice
The figure below shows a family of cost curves for a firm. The subscripts 1, 2, and 3 for the SRATC curves refer to different plant sizes. 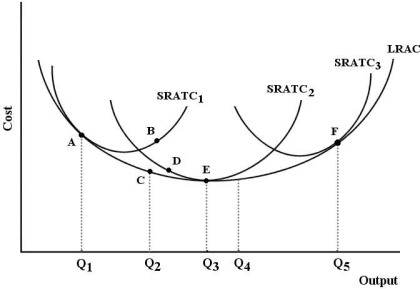 FIGURE 8- 3
-Refer to Figure 8- 3. If this firm is producing at point B, then
A) this firm is producing a level of output that is technically inefficient in the long run.
B) this firm could produce the same level of output at a lower cost with plant size 2.
C) it should employ more of its variable factors of production.
D) this firm is experiencing decreasing returns to scale.
E) plant size 1 is optimal.
Correct Answer:

Verified
Correct Answer:
Verified
Q53: In the long run, the law of
Q54: When a firm seeks to minimize costs
Q55: A firm operates at its least- cost
Q56: When there is no other way of
Q57: Of the following, which is the least
Q59: If there is a fall in all
Q60: Suppose a firm experiences decreasing returns to
Q61: "The bigger the volume, the lower the
Q62: A firm trying to maximize its profits
Q63: If a firm is using labour and