Multiple Choice
The figure below shows a family of cost curves for a firm. The subscripts 1, 2, and 3 for the SRATC curves refer to different plant sizes. 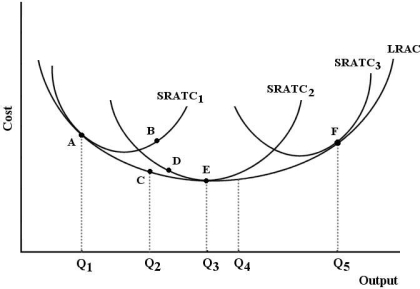 FIGURE 8- 3
-Refer to Figure 8- 3. Suppose this firm is producing output level Q3 with plant size 2. Now suppose this firm changes to plant size 3 and is producing output level Q5. We can say that
A) output has increased exactly in proportion to the increase in inputs.
B) output has increased less than in proportion to the increase in inputs.
C) output has increased more than in proportion to the increase in inputs.
D) this firm has experienced economies of scale.
E) the firm is then operating with the optimal plant size.
Correct Answer:

Verified
Correct Answer:
Verified
Q22: A cost- minimizing firm will increase its
Q23: Which of the following conditions indicate cost
Q24: Assume a firm is using 6 units
Q25: If there is an improvement in the
Q26: The long- run average cost curve is
Q29: A very- long- run consideration that could
Q30: A short- run average total cost curve
Q31: The point of tangency between the short-
Q81: <img src="https://d2lvgg3v3hfg70.cloudfront.net/TB7542/.jpg" alt=" FIGURE 8-2 -Refer
Q87: The following table shows the marginal products