Multiple Choice
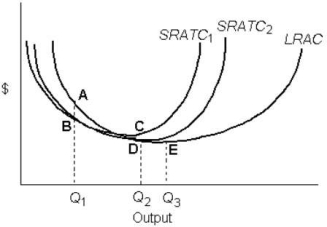 FIGURE 8- 2
-Refer to Figure 8- 2. Decreasing returns to scale occur over the output range
A) 0 to Q3 only.
B) Q1 to Q2 only.
C) Q2 to Q3 only.
D) 0 to Q1 only.
E) beyond Q3 only.
Correct Answer:

Verified
Correct Answer:
Verified
Related Questions
Q13: The figure below shows the isocost lines
Q14: Movement from one point to another along
Q15: Which of the following paired concepts are
Q16: A downward- sloping LRAC curve will shift
Q17: Suppose that capital costs $8 per unit
Q19: Which of the following paired concepts are
Q20: <img src="https://d2lvgg3v3hfg70.cloudfront.net/TB5438/.jpg" alt=" FIGURE 8- 4
Q21: Canada has a much lower population density
Q22: A cost- minimizing firm will increase its
Q23: Which of the following conditions indicate cost