Multiple Choice
The figure below shows the isocost lines and the isoquant map for a firm producing golf tees. 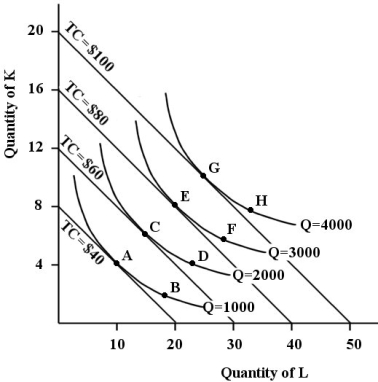 FIGURE 8- 6
-Refer to Figure 8- 6. Suppose this firm is producing 3000 golf tees and is at point F on the isoquant map. In order to maintain its output and minimize costs this firm should
A) not change its use of factors.
B) employ more capital and less labour.
C) employ more labour and less capital.
D) move to an isocost line further from the origin.
E) move to an isoquant closer to the origin.
Correct Answer:

Verified
Correct Answer:
Verified
Q1: The fact that new methods to extract
Q2: An isoquant shows<br>A) the whole set of
Q4: In defining a firm's long- run average
Q5: If factor prices decrease,<br>A) there will be
Q6: Increasing returns to scale<br>A) means that output
Q7: Which of the following is unlikely to
Q8: A short- run average total cost curve
Q9: <img src="https://d2lvgg3v3hfg70.cloudfront.net/TB5438/.jpg" alt=" FIGURE 8- 4
Q10: Suppose that capital costs $10 per unit
Q11: Assume a firm is using 10 units