Multiple Choice
The figure below shows the isocost lines and the isoquant map for a firm producing golf tees. 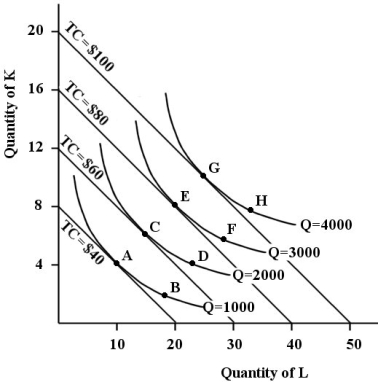 FIGURE 8- 6
-Refer to Figure 8- 6. Suppose the firm is currently producing at point E and the prices of capital and labour each increase by 30 percent. If the firm wants to minimize the cost of producing the same level of output, the firm's chosen factor combination would be at point
A) G.
B) E.
C) not determinable from the information provided.
D) A.
E) C.
Correct Answer:

Verified
Correct Answer:
Verified
Q75: Which of the following cost curves demonstrate
Q76: The following table shows the marginal
Q77: <img src="https://d2lvgg3v3hfg70.cloudfront.net/TB5438/.jpg" alt=" FIGURE 8- 4
Q78: Movement from one point to another along
Q79: Although capital is a variable factor in
Q81: A profit- maximizing firm will increase its
Q82: A profit- maximizing firm with variable labour
Q83: <img src="https://d2lvgg3v3hfg70.cloudfront.net/TB5438/.jpg" alt=" FIGURE 8- 4
Q84: The figure below shows the isocost lines
Q85: Assume a firm is using 10 units