Multiple Choice
The diagram below shows some short- run cost curves for a firm. 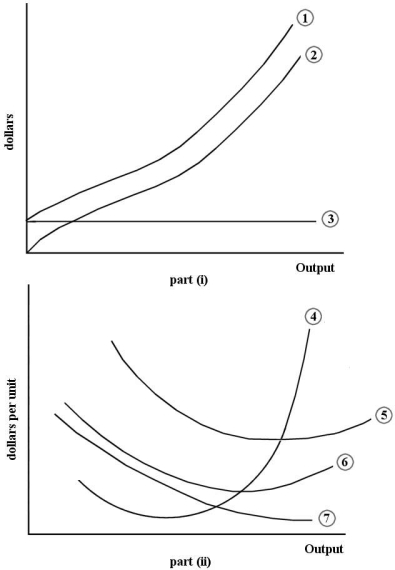 FIGURE 7- 2
  4
4
-Refer to Figure 7- 2. Which of the following choices correctly identifies the cost curves in part (i) of the figure?
A) Curve 1 is the total cost curve. Curve 2 is the total variable cost curve. Curve 3 is the average fixed cost curve.
B) Curve 1 is the total cost curve. Curve 2 is the total variable cost curve. Curve 3 is the total fixed cost curve.
C) Curve 1 is the total marginal cost curve. Curve 2 is the total average cost curve. Curve 3 is the total average fixed cost curve.
D) Curve 1 is the total fixed cost curve. Curve 2 is the total variable cost curve. Curve 3 is the total cost curve.
E) Curve 1 is the total variable cost curve. Curve 2 is the total cost curve. Curve 3 is the total fixed cost curve.
Correct Answer:

Verified
Correct Answer:
Verified
Q1: The following data show the total
Q2: <img src="https://d2lvgg3v3hfg70.cloudfront.net/TB5438/.jpg" alt=" FIGURE 7- 1
Q5: The table below shows output, marginal
Q6: With regard to economic decision making for
Q7: Suppose that when one additional unit of
Q8: The opportunity cost to a firm of
Q9: The table below provides information on
Q10: The table below shows output, marginal
Q78: The following data show the total output
Q131: The period of time over which at