Multiple Choice
The figures below show Chris's consumption of specialty coffee per week. 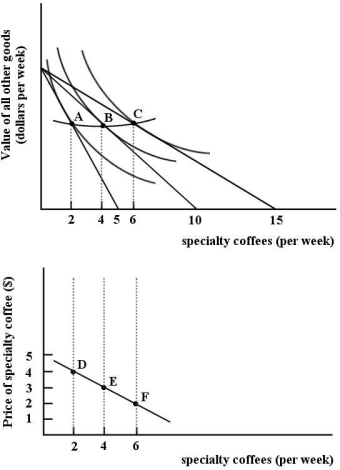 FIGURE 6- 9
-Refer to Figure 6- 9. The line connecting points A, B and C is _ . The line connecting points D, E and F is .
A) the budget line; the price- consumption line
B) the demand curve; the budget line
C) the income- consumption line; the demand curve
D) the price- consumption line; the demand curve
E) the income- consumption line; the budget line
Correct Answer:

Verified
Correct Answer:
Verified
Q28: <img src="https://d2lvgg3v3hfg70.cloudfront.net/TB5441/.jpg" alt=" FIGURE 6-2 -Refer
Q34: The figures below show Chris's consumption of
Q35: The figures below show Chris's consumption of
Q37: Since there is a limited supply of
Q38: <img src="https://d2lvgg3v3hfg70.cloudfront.net/TB5438/.jpg" alt=" FIGURE 6- 2
Q40: <span class="ql-formula" data-value="\text { Toffee (bars) \quad
Q41: The table below shows the total
Q43: Indifference theory is based on the assumption
Q44: <img src="https://d2lvgg3v3hfg70.cloudfront.net/TB5438/.jpg" alt=" FIGURE 6- 1
Q98: At a garage sale,Dominique purchases a sewing