Multiple Choice
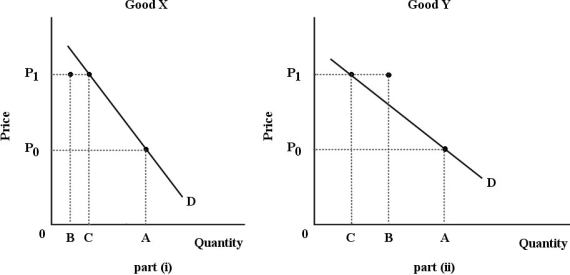 FIGURE 6- 4
-Refer to Figure 6- 4. For both goods, the price increases from P0 to P1. The substitution effect is illustrated by the change in quantity demanded from A to B; the income effect is illustrated by the change in quantity demanded from B to C. Good Y is certainly a(n) good.
A) normal
B) Giffen
C) luxury
D) necessity
E) inferior
Correct Answer:

Verified
Correct Answer:
Verified
Q103: <span class="ql-formula" data-value="\text { Dave's Consumer Surplus
Q104: <img src="https://d2lvgg3v3hfg70.cloudfront.net/TB5438/.jpg" alt=" FIGURE 6- 2
Q105: The real purchasing power of an individual
Q106: Economists use the term "marginal utility" to
Q107: For your typical consumption levels of water
Q109: The table below shows the total
Q110: The income effect refers to the change
Q111: Suppose the price of potatoes falls and
Q112: The demand curve for a good with
Q113: The substitution effect of a price change<br>A)