Multiple Choice
The diagram below shows a set of budget lines facing a household. 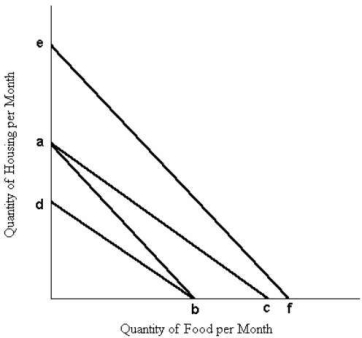 FIGURE 6- 7
-Refer to Figure 6- 7. The movement of the budget line from ab to ef could be caused by
A) a decrease in money income.
B) an equal percentage increase in the price of both food and housing.
C) an equal percentage decrease in the price of both food and housing.
D) a decrease in the price of either food or housing.
E) an increase in the price of either food or housing.
Correct Answer:

Verified
Correct Answer:
Verified
Q83: A parallel shift in the consumer's budget
Q84: The marginal rate of substitution<br>A) is equal
Q85: Economists usually assume that consumers<br>A) are motivated
Q86: If total utility is decreasing as more
Q87: <img src="https://d2lvgg3v3hfg70.cloudfront.net/TB5438/.jpg" alt=" FIGURE 6- 5
Q89: Suppose there are only two goods, A
Q90: If consumption of a good generates a
Q91: The table below shows the total
Q92: <span class="ql-formula" data-value="\text { Dave's Consumer Surplus
Q93: When a consumer's marginal rate of substitution