Multiple Choice
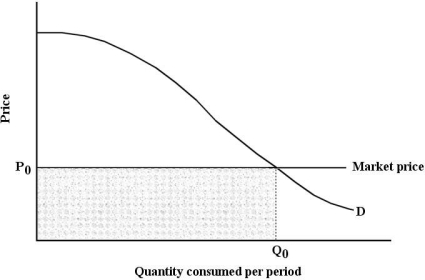 FIGURE 6- 6
-Refer to Figure 6- 6. Suppose that price is P0. Total consumer surplus is then given by the area
A) under the demand curve to the left of Q0, but above P0.
B) under the demand curve to the left of Q0.
C) under the entire demand curve.
D) above the market price.
E) below P0 and to the left of Q0.
Correct Answer:

Verified
Correct Answer:
Verified
Q2: The table below shows the quantities of
Q74: The "law" of diminishing marginal utility implies
Q75: If the price of a normal good
Q76: <img src="https://d2lvgg3v3hfg70.cloudfront.net/TB5438/.jpg" alt=" FIGURE 6- 6
Q77: The condition required for a consumer to
Q80: The substitution effect is<br>A) the change in
Q81: The figures below show Chris's consumption of
Q82: <img src="https://d2lvgg3v3hfg70.cloudfront.net/TB5438/.jpg" alt=" FIGURE 6- 1
Q83: A parallel shift in the consumer's budget
Q84: The marginal rate of substitution<br>A) is equal